![]()
Transcriptome analysis of dRNA nanopore data
I、Project information
II、Workflow

III、Reference information
-
Species name: #
-
Reference: #
-
Annotation: #
IV、Analysis results
1. QC report
Path: ./dRNA_results/QC/
Barcode06
Summary
LengthvsQualityScatterPlot_dot

LogTransformed_HistogramReadlength

Barcode07
Summary
LengthvsQualityScatterPlot_dot

LogTransformed_HistogramReadlength

Barcode08
Summary
LengthvsQualityScatterPlot_dot

LogTransformed_HistogramReadlength

Barcode09
Summary
LengthvsQualityScatterPlot_dot

LogTransformed_HistogramReadlength

2. Alignment report
Path: ./dRNA_results/alignment/
Barcode06
Summary
Barcode07
Summary
Barcode08
Summary
Barcode09
Summary
3. Transcriptome assembly results
Path: ./dRNA_results/assembly/
-
*.gtf: GTF files for each sample contain the assembled transcripts and gene abundances. Furthermore, there is a merged GTF file from a set of GTF files.
-
*.info: gene abundance report files for each sample
-
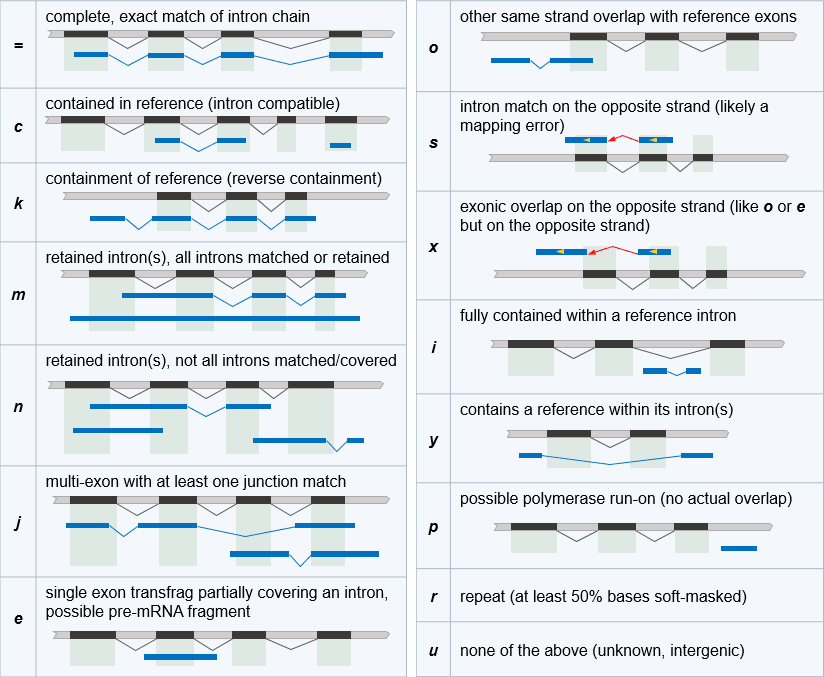
*.tmap: the most closely matching reference transcript for each query transcript. Class code contained in *.tmap is the type of relationship between the query transcript and the reference transcript. ( as described there )
-
*.stats: data summary and accuracy estimation of new annotation file.
-
Base level: exon bases overlap
-
Exon level: exon overlap or match
-
Intron level: intron match
-
Intron chain level: match all the introns
-
Transcript level: transcript match
-
Locus level: observed locus match
-
4. Differential expression analysis
Path: ./dRNA_results/Result/DEanalysis
Each analysis is based on the read count matrix.
Analysis result
PCA

Heatmap

Interquartile range plot

Volcano plot

MA plot

All to all

5. Gene enrichment analysis
Path: ./dRNA_results/Result/
Summary files
-
ID: annotation id in GO or KEGG database
-
Description: gene function or pathway information
-
Gene ratio: the number of differential expression genes related to the term / the total number of differential expression genes
-
Bg ratio: the number of genes related to the term / the total number of genes
Up
GOenrich

KEGGenrich

Cnet
BP

CC

MF

Down
GOenrich

KEGGenrich

Cnet
BP

CC

MF

6. poly(A) length compare
Path: ./dRNA_results/polya/
Each row corresponds to the output for a given read.
-
contig: reference sequence that this read aligns to
-
posion: 5’ starting position of the alignment to the reference sequence
-
leader_start, adapter_start, polya_start, transcript_start: starting index of each of these consecutive regions (yellow, red, green, purple region of example below). Note that the index start from 0 and are oriented in the 3’-to-5’ direction.

-
read_rate: estimated translocation rate
-
polya_length: estimated polyadenylated tail length
-
qc_tap: validity of the estimate

V、Software lists
Demultiplexing
QC
Alignment
Poly (A) analysis
Transcriptome Assembly
R packages
– R v3.4.4